59 Accounts Payable Statistics for 2026
Are you curious about the state of accounts payable in 2025? Look no further. We’ve curated, vetted, and categorized a list of up-to-date accounts payable statistics that highlight the current landscape, challenges, and future trends in AP processes.
From the costs and time involved in manual invoice processing to the strategic impact of automation and market growth projections, these insights provide a comprehensive overview of the evolving AP environment.
While you are here
Automate invoice data capture for your AP workflow
DocuClipper extracts vendor name, invoice number, line items, tax, and totals from any invoice PDF, structured and ready for approval routing or your accounting system.
Top Accounts Payable Statistics
- 68% of respondents manually key invoices into their ERP/accounting software, while less than 32% have an automated process.
- The average cost of processing an invoice manually is $15.
- There is a positive move towards automation, with 20% of teams already fully automated and 41% planning to automate their payables processes within the next 12 months.
- The market size for Account Payable was valued at USD 1.219 billion in 2023.
General Invoicing Statistics
- Around 37% of businesses continue to rely on paper invoice receipts, increasing the administrative burden on accounts receivable and accounts payable teams while also contributing to higher mailing expenses.
- On average, 57% of invoice data must be manually entered from paper invoices into accounting or ERP systems, leading to inefficiencies and a higher risk of errors.
- According to Grand View Research, the global accounts payable automation market was valued at $3.08 billionand is projected to grow at a compound annual growth rate (CAGR) of 12.8% from 2024 to 2030.
Cost, Time, and Errors in Processing Invoices
- The average cost of processing an invoice manually is $15.
- The average time to process an invoice manually is 14.6 days.
- About 39% of invoices contain errors.
- Nearly half of global respondents (49%) spend more than 5 days per month processing invoices.
- 63% of US teams spend over 5 days, compared to 26% of UK teams. This has improved since 2019, when 66% of respondents spent more than 5 days a month processing invoices.
- 56% of respondents spend more than 10 hours per week processing invoices and administering supplier payments, while only 5% spend less than 1 hour each week. Notably, all respondents who spend less than 1 hour have an automated process.
- 60% of respondents process more than 1,000 invoices per month, and nearly a quarter (23%) process over 10,000 invoices monthly.
- Many businesses have partially automated invoicing systems. Among them, 41% have automated invoice approval workflows, the most common automated task for accounts payable.
Importance and Challenges of Accounts Payable (AP)
- 66% of all businesses find accounts payable (AP) essential.
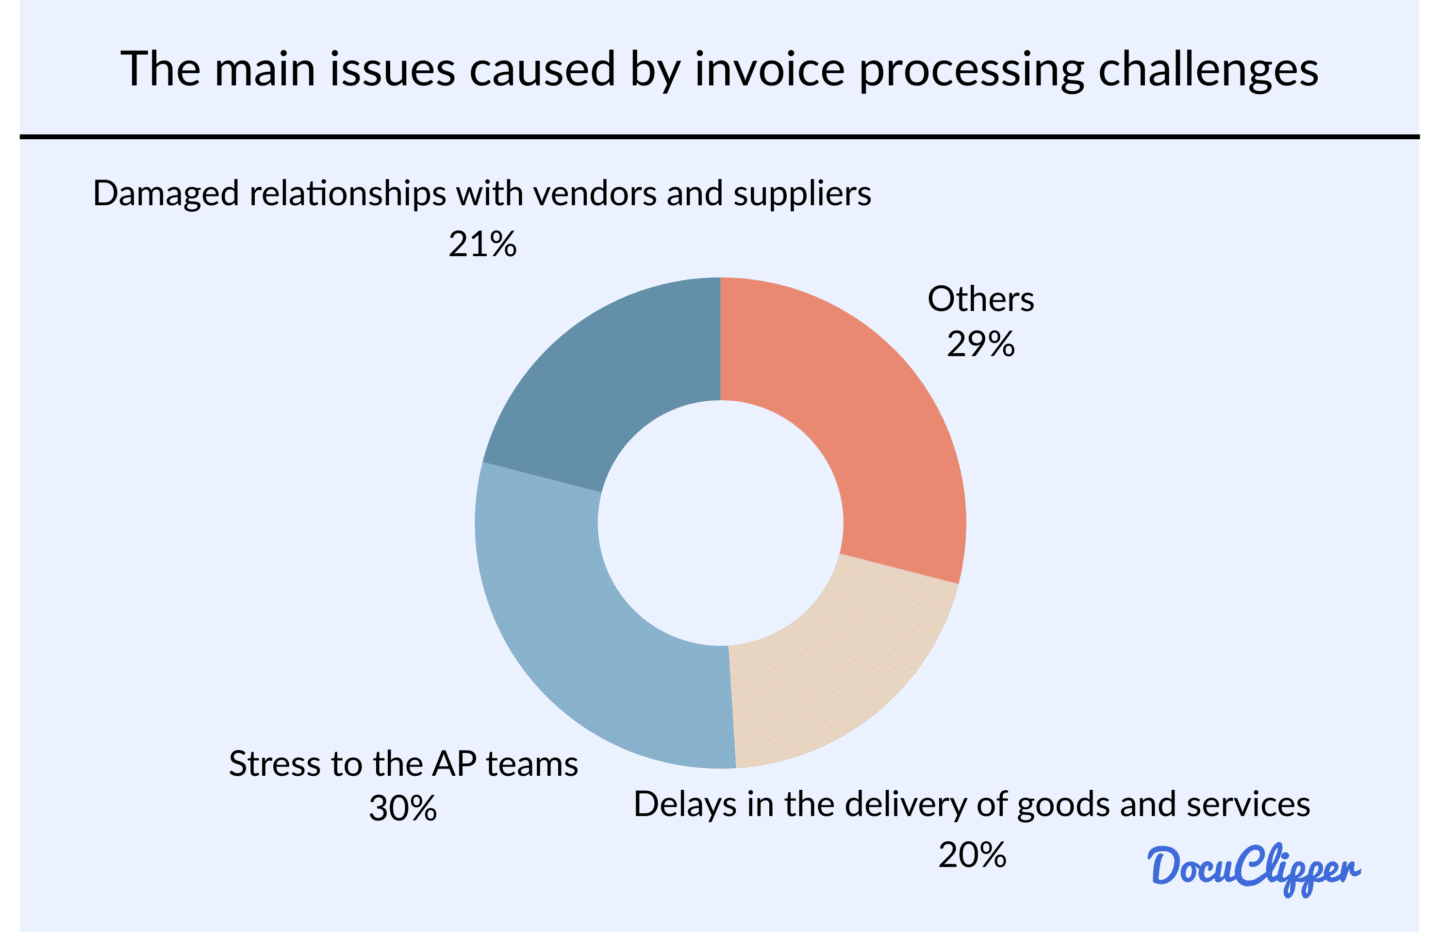
- The main issues caused by processing challenges include stress to the AP teams (30%), damaged relationships with vendors and suppliers (21%), and delays in the delivery of goods and services (20%).
- Top processing challenges for AP teams include the time spent processing invoice exceptions, which causes delays (22%), and too much manual data entry (21%).
- Just under one-third of respondents (31%) state their AP team needs to be equipped to handle a sudden increase in invoice volumes.
- Over one-third of respondents (38%) feel their team could handle a sudden increase well or very well.
Invoice Statistics According to Business Size
- 48% of small businesses still use paper invoices, adding to administrative workload and mailing costs.
- 86% of small and medium-sized businesses manually enter invoice data, increasing inefficiencies and error risks.
- 42% of small businesses send invoices via email, reflecting a shift toward digital invoicing.
- 65% of mid-sized businesses still rely on manual invoice entry, showing a need for automation.
- 38% of mid-sized businesses distribute invoices through email, balancing traditional and digital invoicing.
- 22% of large enterprises still use paper invoices, indicating widespread digital adoption.
- 65% of large businesses have implemented automated invoice data entry systems to improve efficiency.
- 29% of enterprises require six or more approvals for invoice processing, extending approval times to three weeks or more.
Put it into practice
AP teams shouldn't be re-keying invoice data
Manual invoice entry is slow, error-prone, and doesn't scale. OCR extraction captures every field from the PDF directly. No data entry required.
Late Invoicing Statistics

- Research by Atradius indicates that only 36% of invoices in the U.S. are paid on time, while 9% are eventually written off as uncollectible.
- More than half of all invoices issued in the U.S., approximately 55%, are paid after their due date.
- Small Business Insight research found that U.S. small businesses typically receive payments an average of 8 days past the agreed deadline.
- Micro businesses tend to offer shorter payment terms, whereas businesses in the goods sector usually allow longer terms. Among respondents with business customers, 54% set standard payment terms at 30 days after the invoice date, while 11% required payment within 7 days. For micro businesses, this figure increased to 22%.
- A survey conducted by Nerdwallet revealed that 28% of business owners reported that late payments affected their operations to the extent that they had to delay hiring new employees.
Automation Trends and Strategic Impact
- The number of AP teams that are fully automated has nearly doubled in the last two years with 9% fully automated compared with 5% a year ago.
- There is a positive move towards automation, with 20% of teams already fully automated and 41% planning to automate their payables processes within the next 12 months.
- Most of the already automated processes are invoice management (25%), PO management (17%), and expense management (17%). Tools like a bank statement converter are increasingly being adopted to streamline financial data integration further.
- 17% of respondents anticipate their AP department reaching full automation within 6-12 months, compared to 12%.
- 41% of UK respondents and 32% of US respondents expect automation to rise.
- The 42% of respondents consistently expect full automation within 1-3 years:
- 68% of invoice data is entered into the ERP software manually by AP teams.
- 41% of respondents were not expecting to automate the process before 12 months, while 42% of them underlined that full AP automation can take 1-3 years.
- Most of the already automated processes are invoice management (25%), PO management (17%), and expense management (17%).
- 88% of respondents believe that improving invoice management and supplier payments would free up their finance team to focus on more strategic initiatives.
Invoice management

- A study by Xerox suggests that businesses can cut costs by up to £10 per invoice by transitioning from paper-based invoicing to electronic invoicing.
- The U.S. Treasury estimated that adopting e-invoicing across the entire federal government could lower costs by 50%, resulting in annual savings of $450 million.
- In a fully automated system, an accounts payable full-time equivalent (FTE) can handle 23,333 invoices per year, whereas a completely manual process limits that number to just 6,082 invoices annually.
Market Trends and B2B Payment Strategies
- Only 9% of respondents think that their method of measuring AP metrics and KPIs is extremely effective.
- 66% of businesses still use Excel spreadsheets, and 38% use whiteboards, emails, or nothing.
- The Account Payable Market size is projected to grow from USD 1.4182 billion in 2024 to USD 2.791 billion by 2032, exhibiting a compound annual growth rate (CAGR) of 8.83% during the forecast period (2024 – 2032).
- The market size for Account Payable was valued at USD 1.219 billion in 2023.
- Top B2B payment strategies in AP were focused on paying invoices that are due and or payments are late by 59%. Paying early to receive discounts followed by 32%.
- Spend on the Accounts payable invoice automation software and supplier e-invoicing software markets will be nearly $1.75 billion through 2026, up from approximately $925 million in 2021, at a compound annual growth rate (CAGR) of 14%.
Related Information
Looking for more statistics? Check out these resources:
- Accounting and Bookkeeping Statistics 2025
- Credit Card Debt Statistics 2025
- Data Entry Statistics 2025
- 7 Human Error Statistics 2025
- Accounts Receivable Statistics 2025
Or use these resources to learn more about data entry processes:
Next step
Close the gap between invoice and payment
Start free. Extract your first invoices and see structured line items ready for your AP process. No templates, no setup required.